Cities are plagued by traffic jams. How can administrations reduce congestion? We analyze the road capacity depending on the driving speed and compute the speed limit at which the largest number of cars can pass a given road section. We find the maximum to be about 2000 cars, at the optimal velocity of 31km/h. Therefore citizen’s time wasted due to traffic congestion can be minimized by decreasing urban speed limits to 30km/h.
Updated versions of this and related articles in English, German, and Italian are available on https://nielsbenedikter.de/traffic.html as PDF for download or to be read directly online.
At which velocity does a road permit the largest number of cars to pass through? There are two dentimentral effects of higher velocity: on the one hand cars pass faster (so larger velocity should increase the number of cars that can pass), on the other hand the distances between cars grow (so larger velocity should decrease the number of cars that can pass the street). At which velocity do we have the best compromise between these two effects, and thus: What speed limit minimizes congestion?
Consider a single lane of a city road. We place ourselves at an arbitrary point on the side of the lane and count how many cars pass if everyone moves with velocity \(v\). Watching for one hour, this is a line of cars of length \[L = \textnormal {velocity} \cdot \textnormal {time period} = v \cdot 1 \textnormal{h} \;.\] The faster the cars go, the longer a line can pass me. How many cars are there in this line?
Of course we may say: make them tailgate. But this is urban traffic. Traffic lights turning red, traffic jams, pedestrian crossings, cars parking or unparking, drivers suddenly coming out of side streets, and so on – you have to slow down or stop frequently to not crash. A crash definitely causes a big traffic jam, and therefore we need a braking distance between cars. Cars cannot drive to close together.
Let’s compute the safety distance \(d\) that we need to avoid crashes. It has two parts, \(d_1\) and \(d_2\) which I’ll explain in a moment, so \[d = d_1 + d_2 \;.\] The first part is the time that the driver and car need to react: the time for the driver to perceive the necessity to stop (reaction time), the time it takes the driver’s foot to hit the brake then, and the time for the brake to build up pressure. Assuming that the driver stays attentive to traffic, does not look at the phone and is not drunk or tired, this is observed [Rei22] to be on average a bit less than one second \[t_1 = 0.8\textnormal{s} \;.\] During this period the car still travels at full speed, covering the distance \[d_1 = \textnormal {velocity} \cdot \textnormal {time period} = v \cdot t_1 \;.\] Now the brakes start to slow down the car. How long does it take the car to stop? Under good conditions [Ins23] (in particular on dry surface) the deceleration is \(a = 8 \textnormal{m}/\textnormal{s}^2\). That means, during every second of braking, the velocity is reduced by \(8\textnormal{m}/\textnormal{s}\). So the velocity is zero, i. e., the vehicle stopped, after a time period \[t_2 = \frac {\textnormal {initial velocity}}{\textnormal {deceleration}}= \frac {v}{a}\;.\] Now remember your physics class [CK-23]: while braking, the car travels a distance \[d_2 = \frac {a}{2} t_2^2 = \frac {a}{2} \left ( \frac {v}{a} \right )^2 = \frac {v^2}{2a}\;.\] So to not crash and send the traffic into a complete breakdown sooner or later, drivers need to keep a safety distance \[d = v \cdot t_1 + \frac {v^2}{2a} \;.\] I hear you saying “But but but the car in front is also moving and can’t stop from one instant to the other, it will slow down gradually as the car behind…” yes, I’m aware of that, read Section 3 for a discussion of your doubt. I will convince you that the model is correct. For the moment, let’s analyze the model.
On top of the braking distance we have to remember that the cars themselves have a certain length. In 2019 the average length of cars in Germany [Chr20], and similarly in the rest of Western Europe, was \(\ell = 4.6\textnormal{m}\) (and growing).
We can now compute how many cars there are in the line of length \(L\): it is the length of the line divided by the distance occupied by each car: \[ N = \frac {L}{d + \ell } = \frac {v\cdot 1\textnormal{h}}{v \cdot 0.8\textnormal{s} + \frac {v^2}{16\textnormal{m}/\textnormal{s}^2} + 4.6\textnormal{m}} \;. \] Remember that this model describes the best case: if all drivers drive exactly at the speed limit \(v\), nobody crawling, nobody over-accelerating and then braking hard, and generally every driver staying very attentive to react immediately. In real life, \(N\) is less because drivers get distracted, drive to fast, then break abruptly and cause traffic jams, or crash.
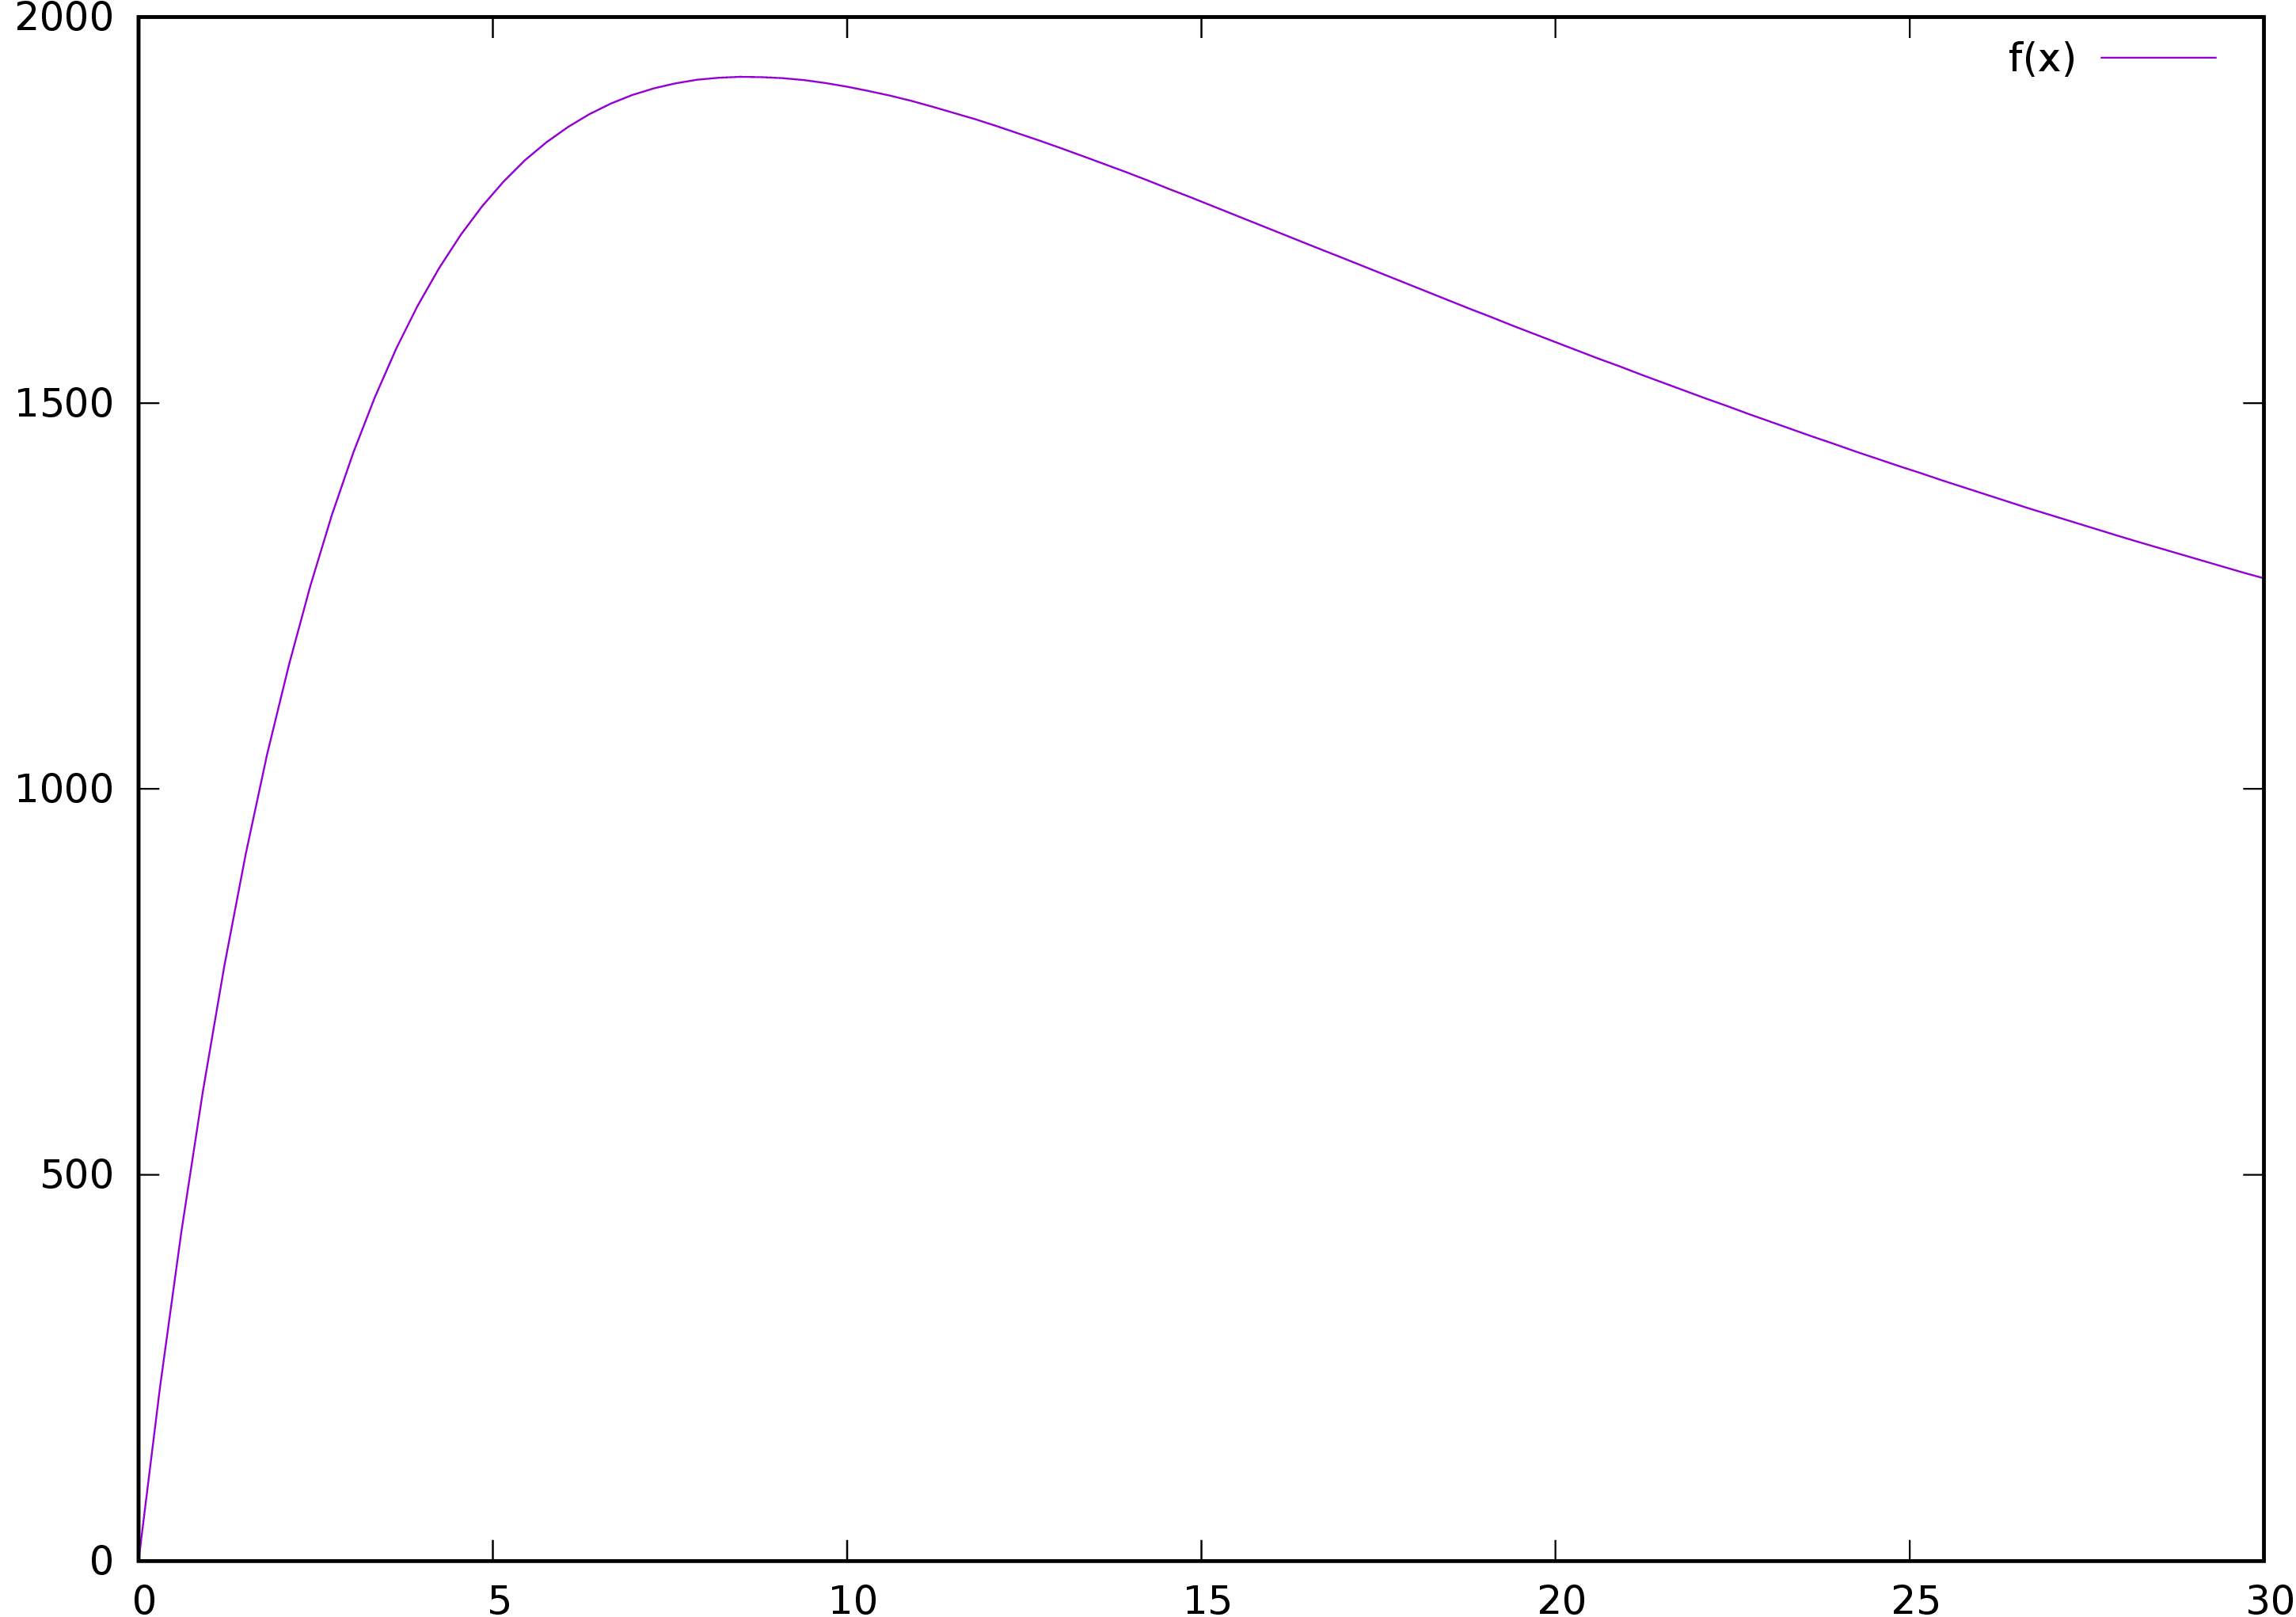
If we measure the velocity in metres per second (instead of kilometres per hour), and write one hour as 3600 seconds, \(1\textnormal{h} = 3600\textnormal{s}\), we can forget about the measurement units in the formula. Then the road capacity (which is just the number of cars passing the observer) is \[\boxed {N(v) = \frac {3600 v}{0.8 v + \frac {v^2}{16} + 4.6} \quad \textnormal {at velocity $v$ measured in meters per second}} \;.\] It just remains to find the velocity \(v\) at which the number of cars \(N(v)\) becomes maximal. This is a mathematical task we undertake in the next section, first with the help of a computer for those of you who don’t like computations, then by hand using basic college level maths.
The function \(N(v)\) is sketched in Figure 1. We need to find the velocity \(v\) at which the number of cars becomes largest, i. e., the position of the maximum of \(N(v)\).
Computer solution
Before discussing the solution “by hand”, let’s take a shortcut: go to https://www.wolframalpha.com and enter the following
maximum of 3600*v/(0.8*v+v^2/16+4.6)
then hit return. WolframAlpha computes that the maximal number of cars is \begin {equation} \label {eq:maxnumber} N_\textnormal {max} = \frac {12000}{17}\left ( \sqrt {115} - 8 \right ) \simeq {1923}\textnormal{cars} \end {equation} for the speed limit at velocity \begin {equation} \label {eq:bestvel} v = 4\sqrt {\frac {23}{5}}{\textnormal{m}/\textnormal{s}} \simeq {8.579}{\textnormal{m}/\textnormal{s}} = {30.88}{\textnormal{km}/\textnormal{h}} \;. \end {equation} So the most efficient use of a street (permitting the largest number of cars to pass through without causing a traffic jam or a crash) is if all drivers drive exactly \[\boxed { v = {31}{\textnormal{km}/\textnormal{h}}}\;.\]
For comparison: at \(v = {50}{\textnormal{km}/\textnormal{h}} = {13.88}{\textnormal{m}/\textnormal{s}}\), the number of cars that can pass in one hour reduces to \(N(13.88) = 1801\) cars. And at \(v = {70}{\textnormal{km}/\textnormal{h}} = {19.44}{\textnormal{m}/\textnormal{s}}\), only \(N(19.44) = 1599\) cars can pass through the street. If more drivers try to pass through, for example during rush hour, the difference of \(1923 - 1599 = 324\) cars piles up as a traffic jam. At a length of \(\ell = {4.6}\textnormal{m}\) per car (and adding \({40}\textnormal{cm}\) distance bumper to bumper between cars blocked in the traffic jam), the higher speed limit causes a additional traffic jam of length \[{5}\textnormal{m} \cdot 324 = {1620}\textnormal{m} = {1,62}\textnormal{km}.\] So simply by reducing the speed limit from the common \({70}{\textnormal{km}/\textnormal{h}}\) or \({50}{\textnormal{km}/\textnormal{h}}\) to the optimal \({30}{\textnormal{km}/\textnormal{h}}\) we can shorten the rush hour traffic jam by \({1.6}\textnormal{km}\). Does that sound counter-intuitive to you? Think of it like that: the reduced speed limit leads to a denser line of cars, moving slower but more continuously, leaving less gaps.
Pen & paper solution
If you hate computations, skip this paragraph. Otherwise now I show you how to arrive at the same conclusion by a pen & paper computation without resorting to a computer (don’t worry, it’s very basic, the only thing you need to know are derivatives). To find the maximum of the function \(N(v)\), we compute its derivative using the quotient rule [Wik22]: \[N'(v) = \frac {3600 \Big ( 0.8 v + \frac {v^2}{16} + 4.6 \Big ) - 3600 v \Big ( 0.8 + \frac {v}{8}\Big )}{\Big ( 0.8 v + \frac {v^2}{16} + 4.6 \Big )^2} \;.\] We obtain the position of the maximum by demanding the derivative to be zero and solving for \(v\): \[0 = \frac {3600 \Big ( 0.8 v + \frac {v^2}{16} + 4.6 \Big ) - 3600 v \Big ( 0.8 + \frac {v}{8}\Big )}{\Big ( 0.8 v + \frac {v^2}{16} + 4.6 \Big )^2}\;.\]
But the right hand side can only be zero if the numerator is zero, so it is equivalent to solving \[0 = 3600 \Big ( 0.8 v + \frac {v^2}{16} + 4.6 \Big ) - 3600 v \Big ( 0.8 + \frac {v}{8}\Big )\;.\] We divide by \(3600\) and expand the parenthesis to get \[0 = 0.8 v + \frac {v^2}{16} + 4.6 - 0.8 v - \frac {v^2}{8} = -\frac {v^2}{16} + 4.6\;. \] With \(4.6 = \frac {23}{5}\) we obtain \(v = 4\sqrt {\frac {23}{5}}\), in accordance with WolframAlpha’s result \(\mathrm {(\ref {eq:bestvel})}\).
“But but but you forgot that the car in front is also moving and can’t stop from one instant to the other, it will slow down gradually as the car behind…” OK, you’re right, and I am aware of this fact about stopping a moving car.
Now in this article we are talking about traffic in a city. If we talk about highways, you are right. (See the next article, “How to Reduce Congestion II: Optimal Speed Limit for Highways” for a discussion of traffic and speed limits for highways. Mathematics has to say something on that topic, too. Spoiler: the optimal speed limit for highways is higher than \({30}{\textnormal{km}/\textnormal{h}}\).) On a highway you need to keep less safety distance, basically just a bit more than your reaction time, because the car in front of you cannot stop abruptly either. But in a city? In a city there are other drivings pulling out of parkings, coming out of side streets as soon as the driver in front of you has passed the intersection, people changing lanes without giving notice, traffic lights becoming red, doors of parked cars opening and so on. The flow is not just linear along a street without intersections. Anything can happen. Moreover, some cars have stronger brakes, other cars have weaker brakes. Some drivers are distracted by the cell phone or tired so their reaction times are worse. And many are impatient. You may need to react suddenly, and you may have to come to a complete stop any moment. Still don’t believe me that the model is reasonable?
Yes, our model is very simple. In mathematics such a model is known as a mean-field model, where all drivers behave the same at all times. As mathematicians, we can compare it to more complex models and to simulations. This is beyond the scope of this article, but the results generally confirm our picture. But there is an even better option: we compare to real-life observation.
So is our result realistic? In the end, observation and comparison to the real world have to decide about the applicability of a mathematical model. So let’s take a look at reality. The effects of lowering speed limits in cities have been observed; you can find an overview in [Ger20]. Key observations are the following:
A British study has shown that a speed limit of \({20}\textnormal{miles}/\textnormal{h} = {32}{\textnormal{km}/h}\) has reduced the number of crashs by \(42\%\). This confirms the necessity of a safety distance permitting a complete stop any time (many drivers do not respect the safety distance at higher speeds, thus causing collisions). Of course crashs have to be strictly avoided; they cause huge disruptions and tend to block traffic completely.
A study in Switzerland found \(22\%\) less collisions, accordingly less traffic jams, and accordingly reduced driving times.
While theoretically at \({30}{\textnormal{km}/\textnormal{h}}\) it takes \({4}\textnormal{s}\) longer to travel a distance of \({100}\textnormal{m}\) (compared to \({50}{\textnormal{km}/\textnormal{h}}\)), in reality it is observed that “for speedy progress, the design of intersections and a continuous flow of traffic are far more deciding than the maximum permitted speed” and total travel times have remained equal or slightly reduced after lowering the speed limit.
The maximum number of cars that can pass a single lane in one hour is everywhere observed to be \({1800}\textnormal{cars}\) to \( {2000}\textnormal{cars}\); our model predicted a maximum of \({1923}\textnormal{cars}\) in excellent agreement with this observation in actual cities.
But do cars not pollute more if they go slower? After all, one uses a lower gear, doesn’t one? Measurements collected by [Ger20] show that lower speed limits reduce the main sources of emissions, namely strong acceleration and abrupt braking. Since streets are rarely perfectly flat, straight and free of intersections and traffic lights, these effects are in almost always more significant than the gear.
What about getting people to work efficiently? On average there are 1.45 people per car including the driver [Eur15], during rush hour even less. The maximal number of people in cars on one lane in one hour is, according to \(\mathrm {(\ref {eq:maxnumber})}\), less than \[ {1.45}{\textnormal{people}/\textnormal{car}} \cdot {1923}\textnormal{cars} = {2788}\textnormal{people} \;. \]“The Berlin Senate measured three roads over three years. The nitrogen dioxide1 values fell by between 5.7 and 12.8 per cent after the introduction of the 30 km/h speed limit. Elemental carbon also decreased (between 0.3 and 2.2 per cent), as did particulate matter (1.8 per cent).” [Ger20]
But what if we made electronically controlled cars? And if we placed them in a fixed line one behind the other? You know, like Tesla cars in Elon Musk’s Boring Company tunnel? The bad news is: Elon Musk cannot overcome the limitations of physics, also his tunnel is prone to traffic jams at high demand [Mor22]. The good news is: if you couple those electric vehicles together and make them run on a fixed schedule, say every 3 minutes, it works. But it has been around for ages and is called a subway or metro. A subway line routinely transports \({25 000 }{\textnormal{people}/\textnormal{h}}\). To get that many people to work by car, we would need a highway with 9 lanes toward the city – and 9 more lanes to leave the city again, a total of 18 lanes. A lane on a German highway [Bun09] has a width of \(3.75\textnormal{m}\), so that would make (including emergency lanes) for a highway more than \(70\textnormal{m}\) wide. Imagine bulldozing such gigantic highways through our cities from all directions. Imagine the gigantic cost of construction, of resettling thousands of people, and of destroying cultural heritage and established economical structures. There is a reason why subways work better than highways for urban transportation. And the reason for that boils down to physical laws of acceleration and deceleration and mathematics, as you have learned.
We compared our model to observations in the real world and found very close agreement. In particular, we prove that one and the same street can bring more people to work if the speed limit is lowered to (and enforced) as \(30\textnormal{km}/\textnormal{h}\) because gaps in the traffic flow are smaller at lower velocity. The lower speed limit makes the flow more continuous, reducing the occurrence of traffic jams, thus leading to lower total travel times even though the maximal speed is reduced. A city with an overall limit of \(30\textnormal{km}/\textnormal{h}\) is not only safer, but also more comfortable for drivers because it reduces the amount of time they waste in traffic jams.
[Bun09] Bundesministerium für Digitales und Verkehr. Richtlinien für die Anlage von Autobahnen (RAA). https://bmdv.bund.de/SharedDocs/DE/Anlage/StB/ars-aktuell/allgemeines-rundschreiben-strassenbau-2009-07.pdf Allgemeines Rundschreiben Straßenbau, 7, 2009.
[Chr20] Johannes Christ. Datenanalyse: Autos werden nicht erst seit dem SUV-Boom größer. https://www.rnd.de/wirtschaft/datenanalyse-autos-werden-nicht-erst-seit-dem-suv-boom-grosser-6GTM66RRNJEC7EYHR3FQS7Y24Y.html, February 2020.
[CK-23] CK-12 Foundation. Displacement During Uniform Acceleration. https://flexbooks.ck12.org/cbook/ck-12-physics-flexbook-2.0/section/2.6/primary/lesson/displacement-during-constant-acceleration-phys/, February 2023.
[Eur15] European Environment Agency. Occupancy rates of passenger vehicles. https://www.eea.europa.eu/data-and-maps/indicators/occupancy-rates-of-passenger-vehicles/occupancy-rates-of-passenger-vehicles, August 2015.
[Ger20] Saskia Gerhard. Das wissen wir über Tempolimits. https://www.quarks.de/technik/mobilitaet/faq-tempolimits/, January 2020.
[Ins23] Institut für Unfallanalysen Hamburg. Bremstabelle A. https://unfallanalyse.hamburg/index.php/ifu-lexikon/bremsen/bremstabelle-a/, February 2023.
[Mor22] Jack Morse. Oh look, it’s a Tesla traffic jam in Las Vegas’ Boring Company tunnel. https://mashable.com/article/ces-las-vegas-boring-tunnel-tesla-traffic, January 2022.
[Rei22] Konrad Reif. Kraftfahrtechnisches Taschenbuch. Springer Vieweg, Wiesbaden Heidelberg, 30. aufl. 2022 edition, May 2022.
[The18] The National Institute for Occupational Safety and Health (NIOSH). Immediately Dangerous to Life or Health Concentrations (IDLH): Nitrogen dioxide. https://www.cdc.gov/niosh/idlh/10102440.html, November 2018.
[Wik22] Wikipedia. Quotient rule. https://en.wikipedia.org/wiki/Quotient_rule, December 2022.